
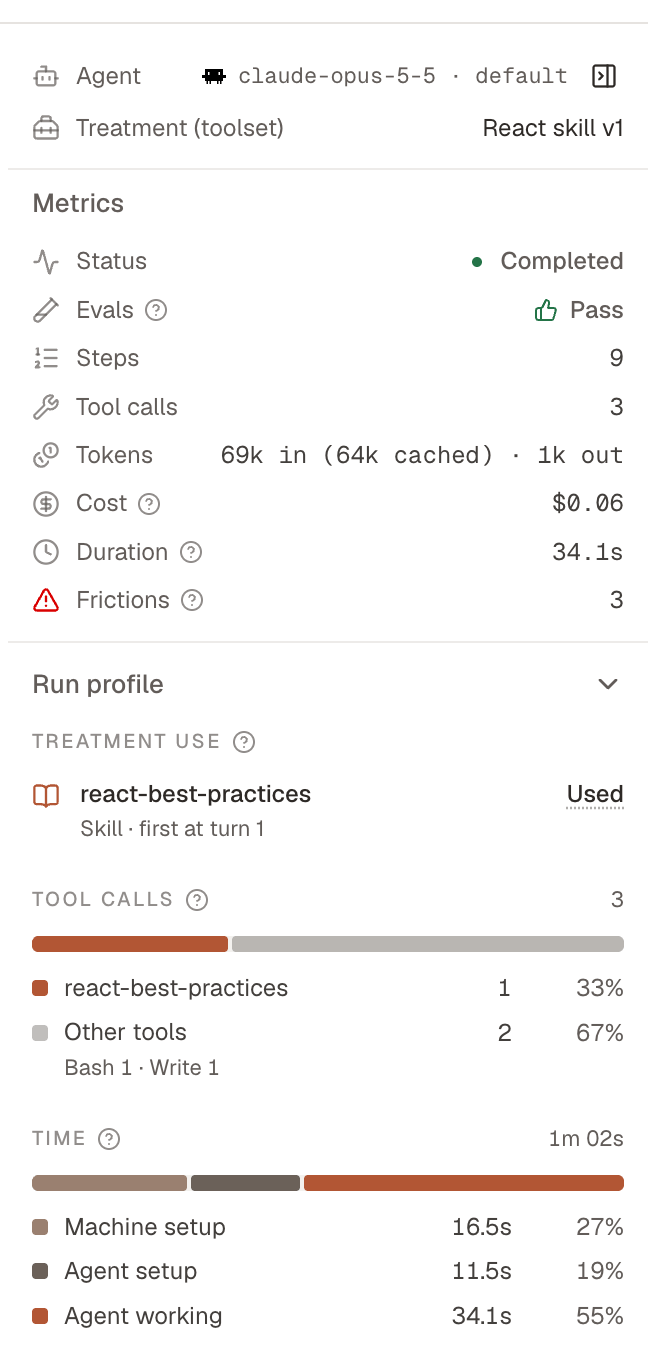
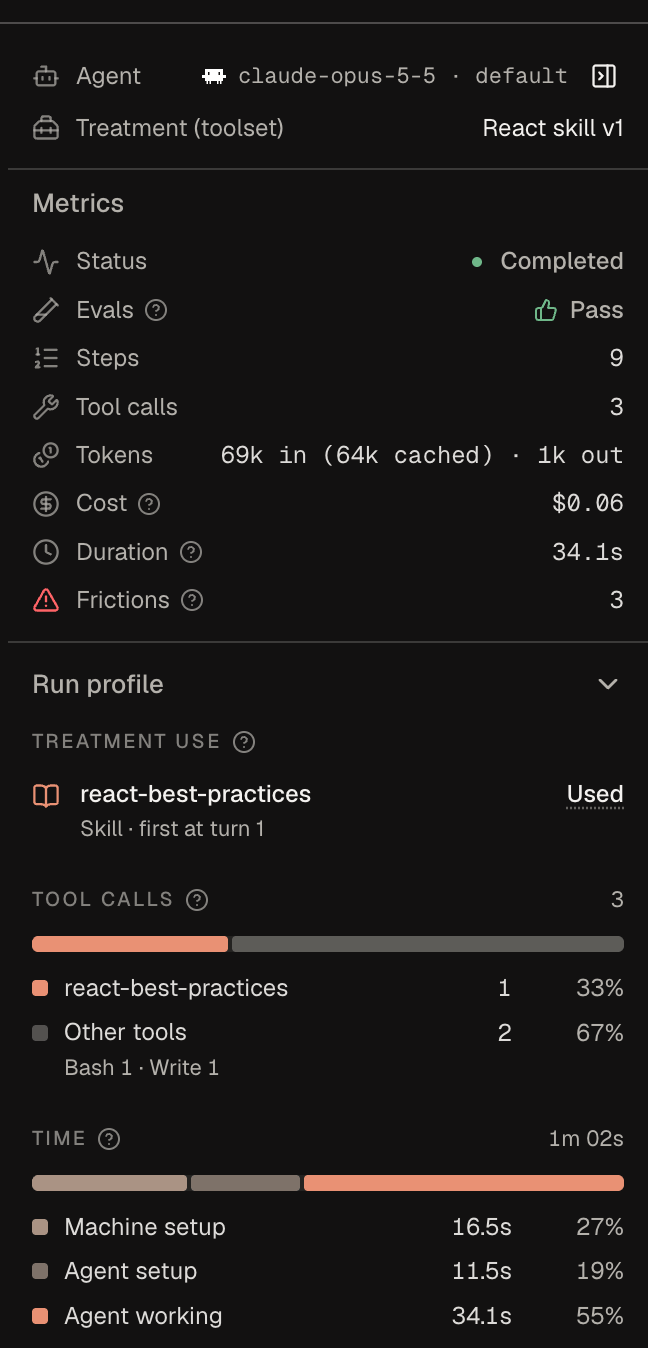
Treatment use
Treatment use says whether the agent used each skill, MCP server, CLI, or SDK in the treatment. The Runs list uses the same states for the whole treatment, and a blank cell there means the run has no run profile (see When the profile cannot answer).
Obss decides use from the agent’s log:
A CLI counts under its command name and every other name its package installs:
@brightdata/cli, for example, installs brightdata and bdata. Obss reads those names from the package’s registry entry when the CLI pins an exact npm or Rust (crates.io) version, or installs with Go. A CLI run through another program (npx, sudo, timeout) or a script doesn’t count, so a CLI no command ran directly shows Can’t tell, not Not used.
When the log can place the first use, the row names that turn or step. Not used is a fact about this run, not a pass or fail result.
Tool calls
Tool calls counts every tool call the agent made, split by what served it: a launched skill, MCP server, or CLI, or Other tools. A call that matches more than one of them counts toward none, and Evidence warnings says so.What stood out
What stood out lists patterns that meet fixed thresholds:- The same tool call repeated with the same input.
- Input that grew by at least 10,000 tokens and by at least 10% in one turn.
- A tool call that took at least 5 seconds and at least 5% of the agent’s working time.
- A gap of at least 10 seconds between two turns, and at least 3 times the run’s median gap, unless a slow tool call above already explains the gap.
Time
Time splits the run into its recorded phases:
A phase with no recorded time is hidden. When phases overlap, the profile says The phase times overlap, so the total isn’t split. When no phase has a time, it says No phase times were recorded for this run. Token totals and cost appear with the time, and an unreported cost stays blank, not $0.
When the profile cannot answer
While the run is going, the profile says The profile appears when the run finishes. If none was recorded, it says No run profile was recorded for this run. A partial profile shows the sections it can, and Evidence warnings names the limit:- No readable agent log was captured for this run.
- This run has no record of what it launched, so its calls can’t be matched to what served them.
- The agent’s log says what served each call, but leaves some calls out.
- The agent’s log names a skill, MCP server, or CLI that this run didn’t launch.
- Some calls match more than one launched skill, MCP server, or CLI, so they count toward none.
- The agent’s log records no tool calls, so it can’t show whether the agent used what the run launched.
From the CLI and the plugin
Next steps
Evals
Learn how Evals mark each run against its rubric.
Frictions
Find the problems that agents hit across runs.
Measure a tool's impact
Compare a tool with the baseline.
obss runs and results
Read a run’s profile with
obss runs profile.